Big Beautiful Data
Before diving into technical details, it's worth pausing to appreciate the scale of what we are working with in AMBER. The project is building an exceptionally rich biodiversity dataset: millions of images, audio clips, and ultrasound recordings that capture the pulse of ecosystems in real time. This is an exciting prospect, but it can also be challenging turning these vast data streams into insight, and requires careful design, and perseverance.
The Scale Behind the Scenes
Behind every ecological insight our system delivers lies massive volumes of data, flowing in from open-source images used to train our models, to the AMI camera systems deployed across different environments.
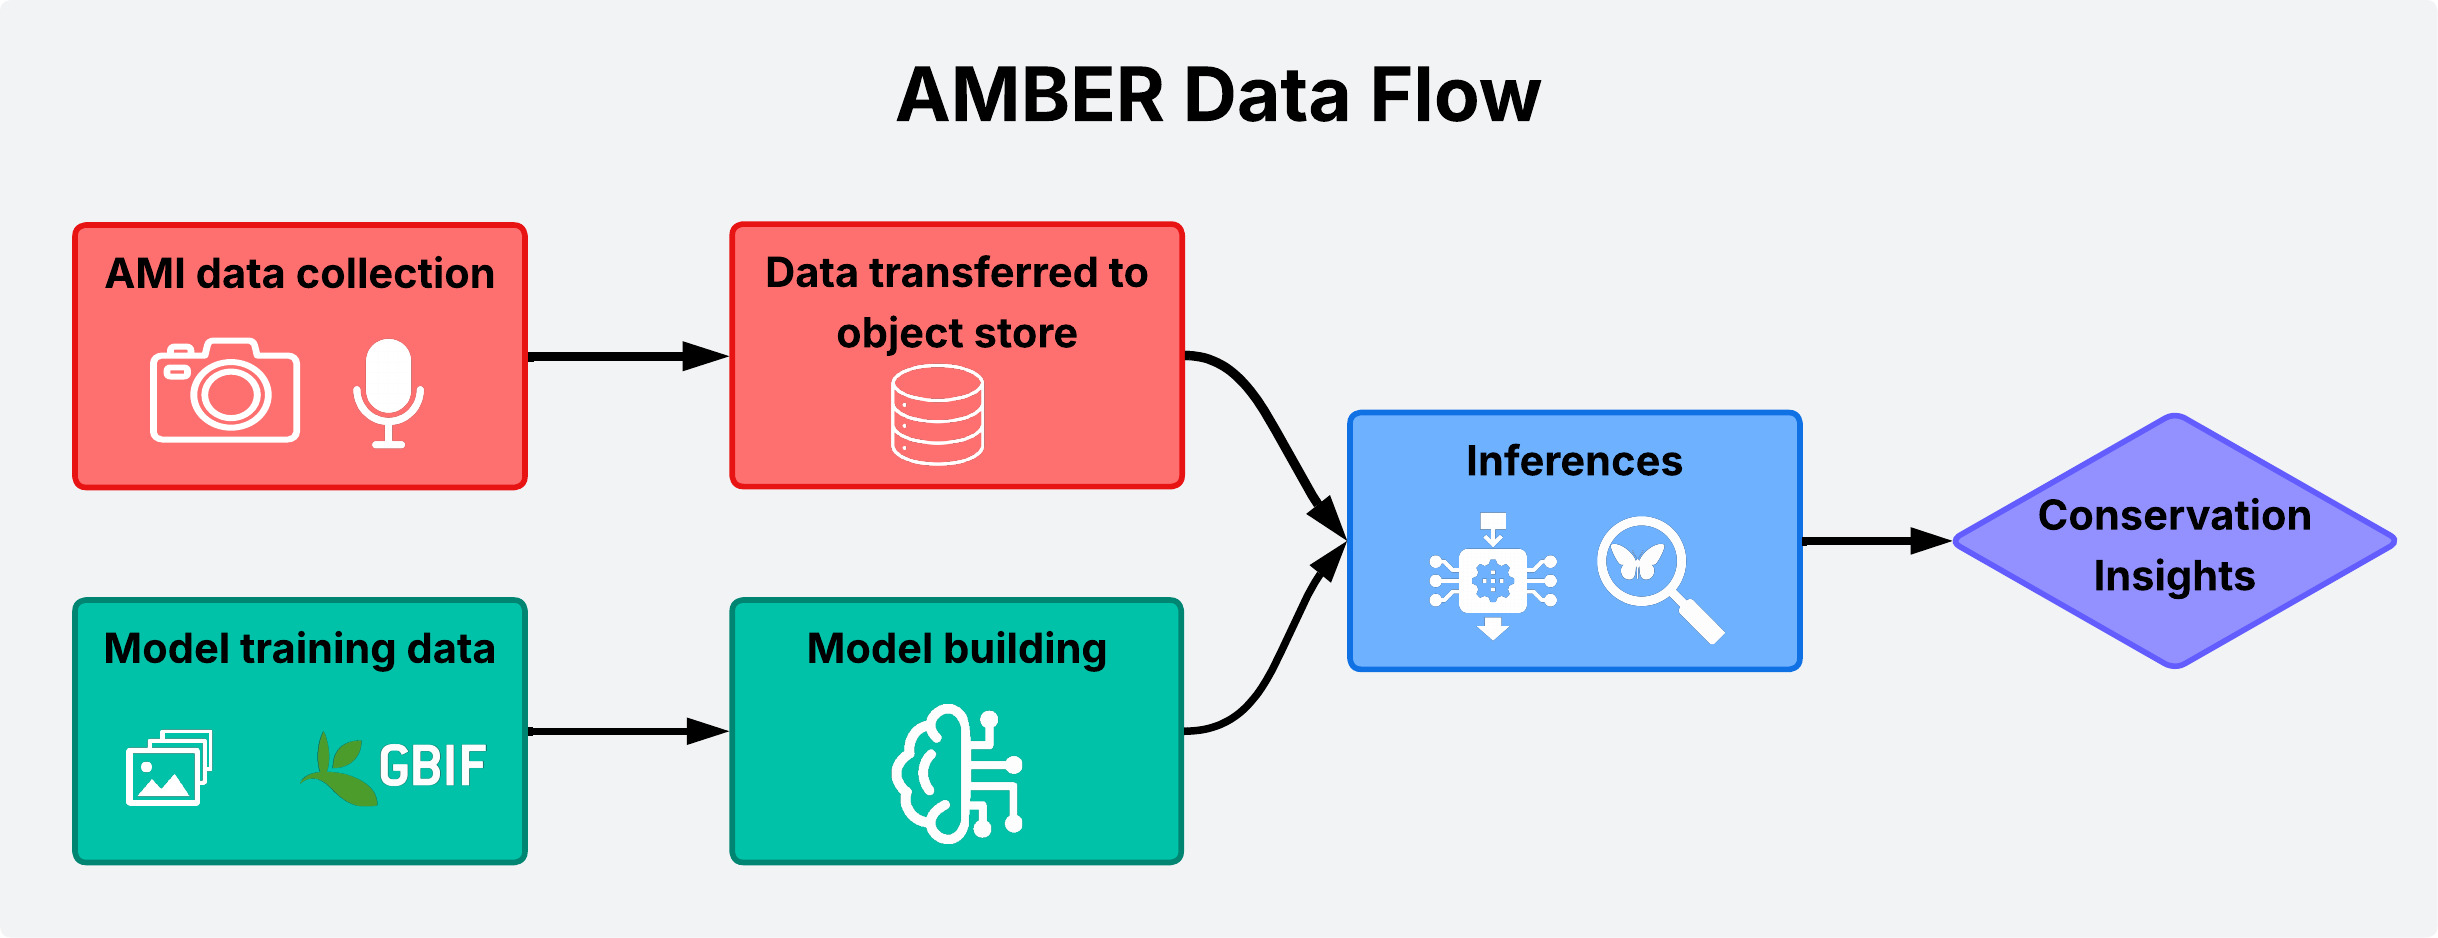
Flow diagram showing how biodiversity monitoring data flows through our AI pipelines to deliver conservation insights.
Currently, our pipeline is designed so that deployment partners upload their image and audio data directly into our object store. From there, the data enters processing and curation workflows, ensuring it is ready for large-scale analysis, and machine learning inferencing. Over the course of the project so far, AMBER has amassed tens of millions of frames, each one a tiny window into an ecosystem. Not only this, but also audio and ultrasound data.
Additionally, before training each machine learning model, we sift through an online resource, GBIF, to curate a set of training images which we can build our models on. The dataset is very large with thousands of informative images selected to teach the models about the intricacies of each species.
Training with GBIF Image Armies
Our models learn at scale. Each image, whether nearly identical to another or completely novel, helps improve robustness. Over time, the system becomes less brittle: better at recognising individual moth species from one another.
We draw on GBIF datasets to enrich training. For each deployment country, we compile an expert-curated list of species known to occur there, then download all available images from GBIF for those species. Ideally, we aim for around 1000 images per species to ensure reliable training. However, in less well documented regions, such as Costa Rica, this target is often out of reach as not enough images have been recorded. These differences reveal where biodiversity records are strong and where important gaps remain.
In total, almost 2 million images were downloaded for training across all our models, built for each deployment country. The bar chart below illustrates this variation, showing for each country the number of species with:
- 0 images
- <100 images
- <1000 images
- 1000+ images available on GBIF.
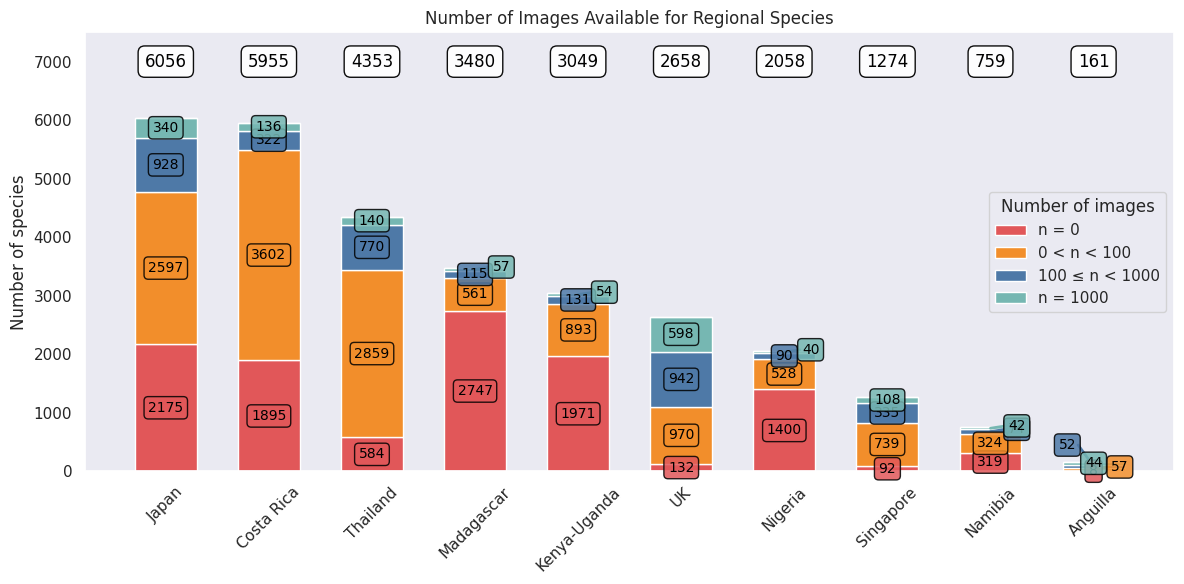
Distribution of available training images per species across different countries, showing data availability from 0 images to 1000+ images per species.
This chart highlights the disparities in data availability across regions. Countries like the UK and Singapore have broad coverage of images for most species, whereas Costa Rica and Madagascar have many species with no images available. This reflects the extent of citizen science contributions in each region, and how difficult it is to develop models which can differentiate between species with little to no data.
Deployment Data
Images from the AMI deployments reveal the vast scale of data we are capturing ourselves through field deployments:
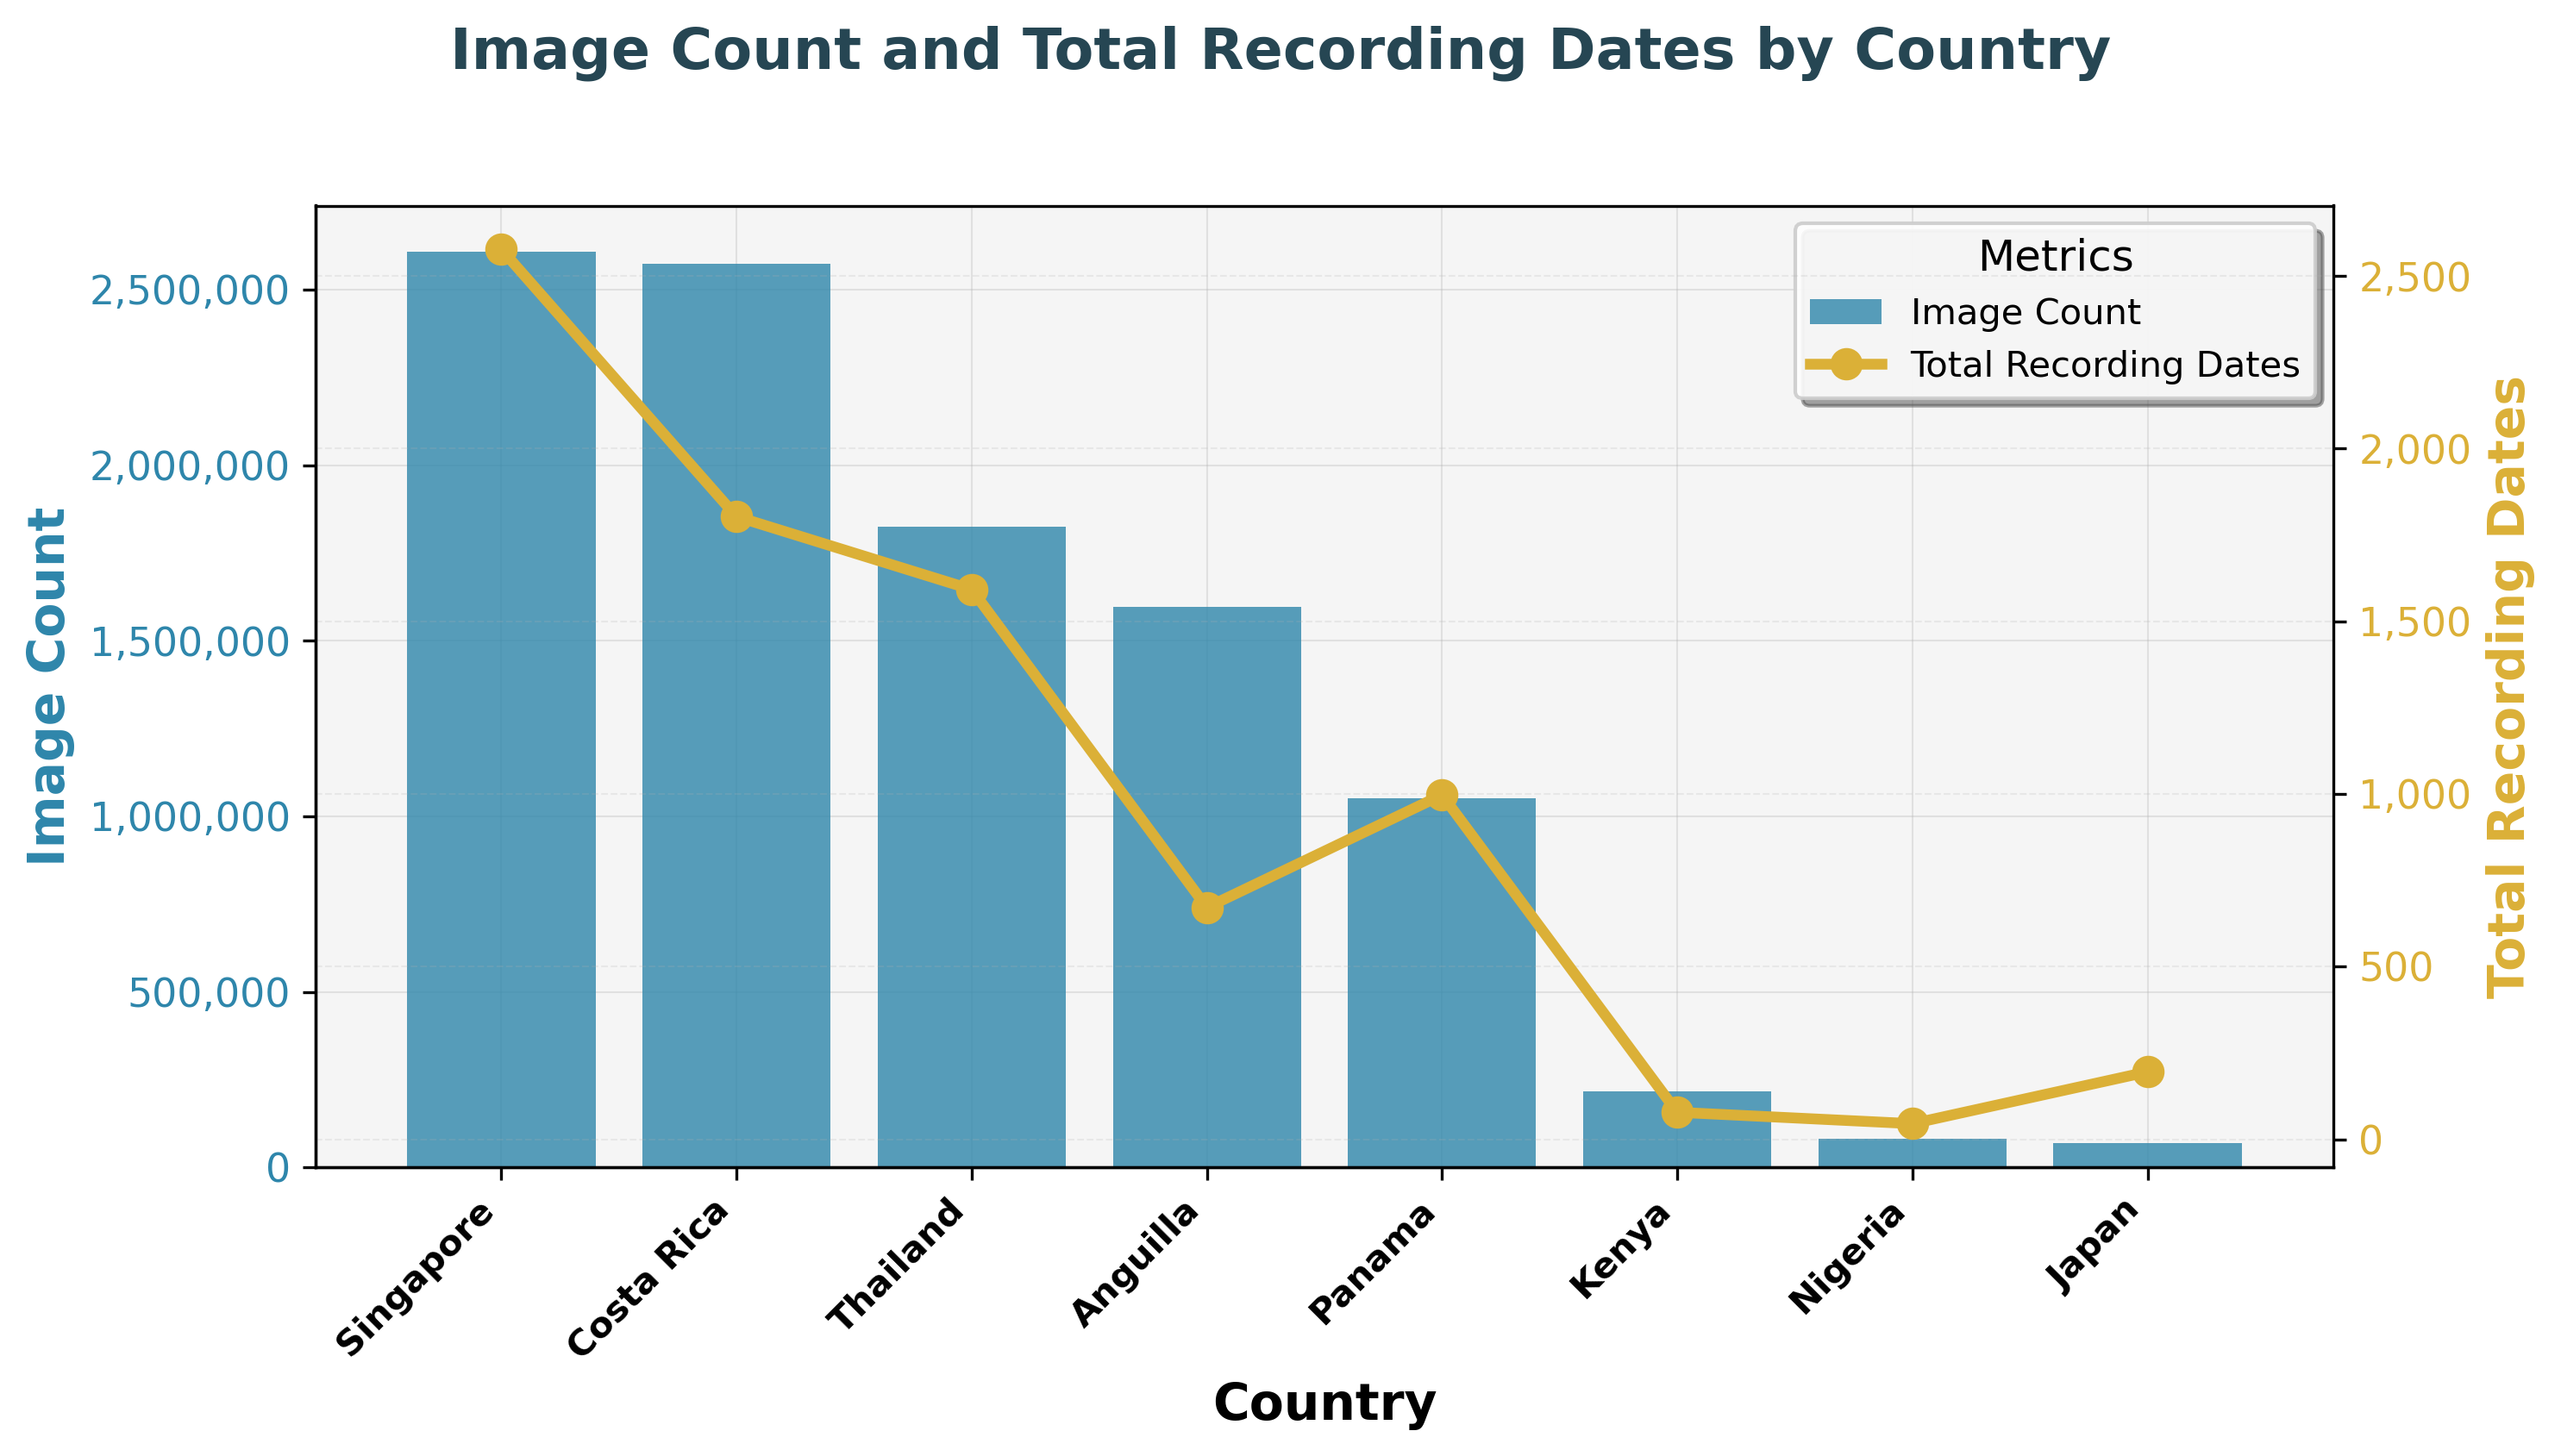
Image counts and total recording dates vary widely across countries, with Singapore and Costa Rica contributing the largest number of images.
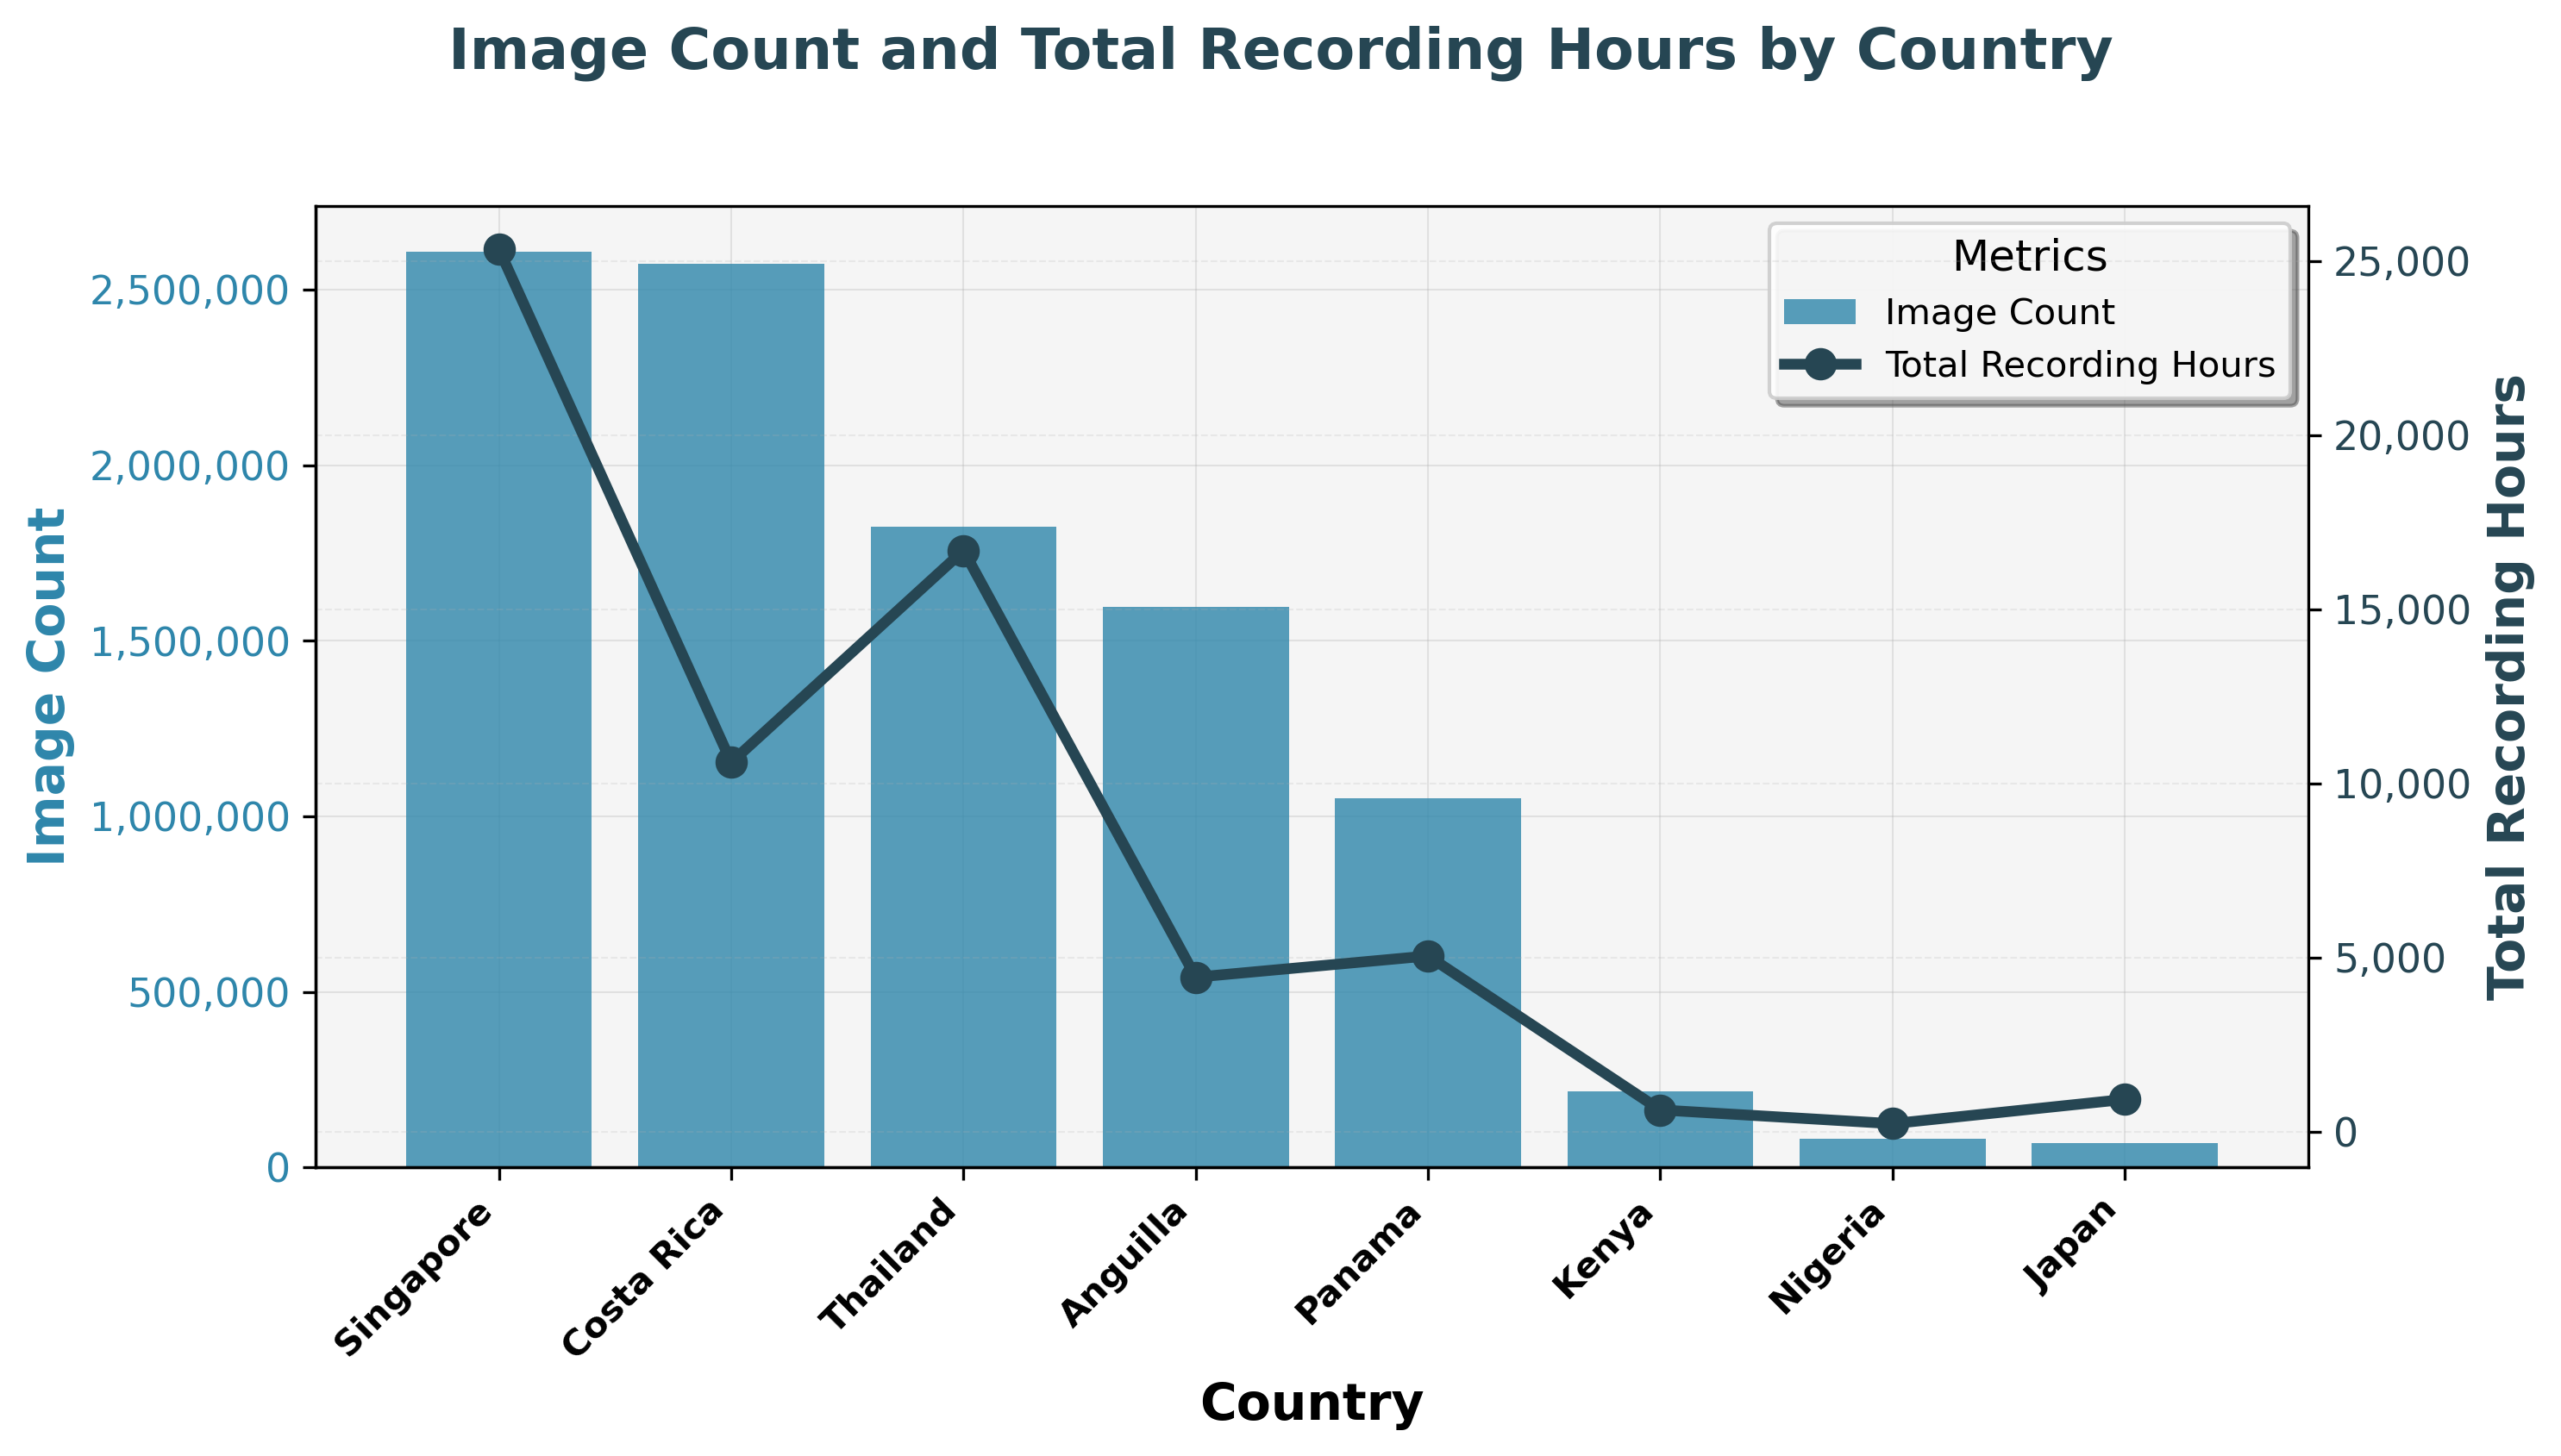
Image counts and total recording hours vary widely across countries, with Singapore and Costa Rica contributing the largest number of images.
The figure above shows the number of images captured per deployment country, alongside the number of recording dates and hours (toggle). Singapore and Costa Rica lead the way, as they were among the first to be deployed. But zooming in further, we can compare the number of images captured per individual deployment:
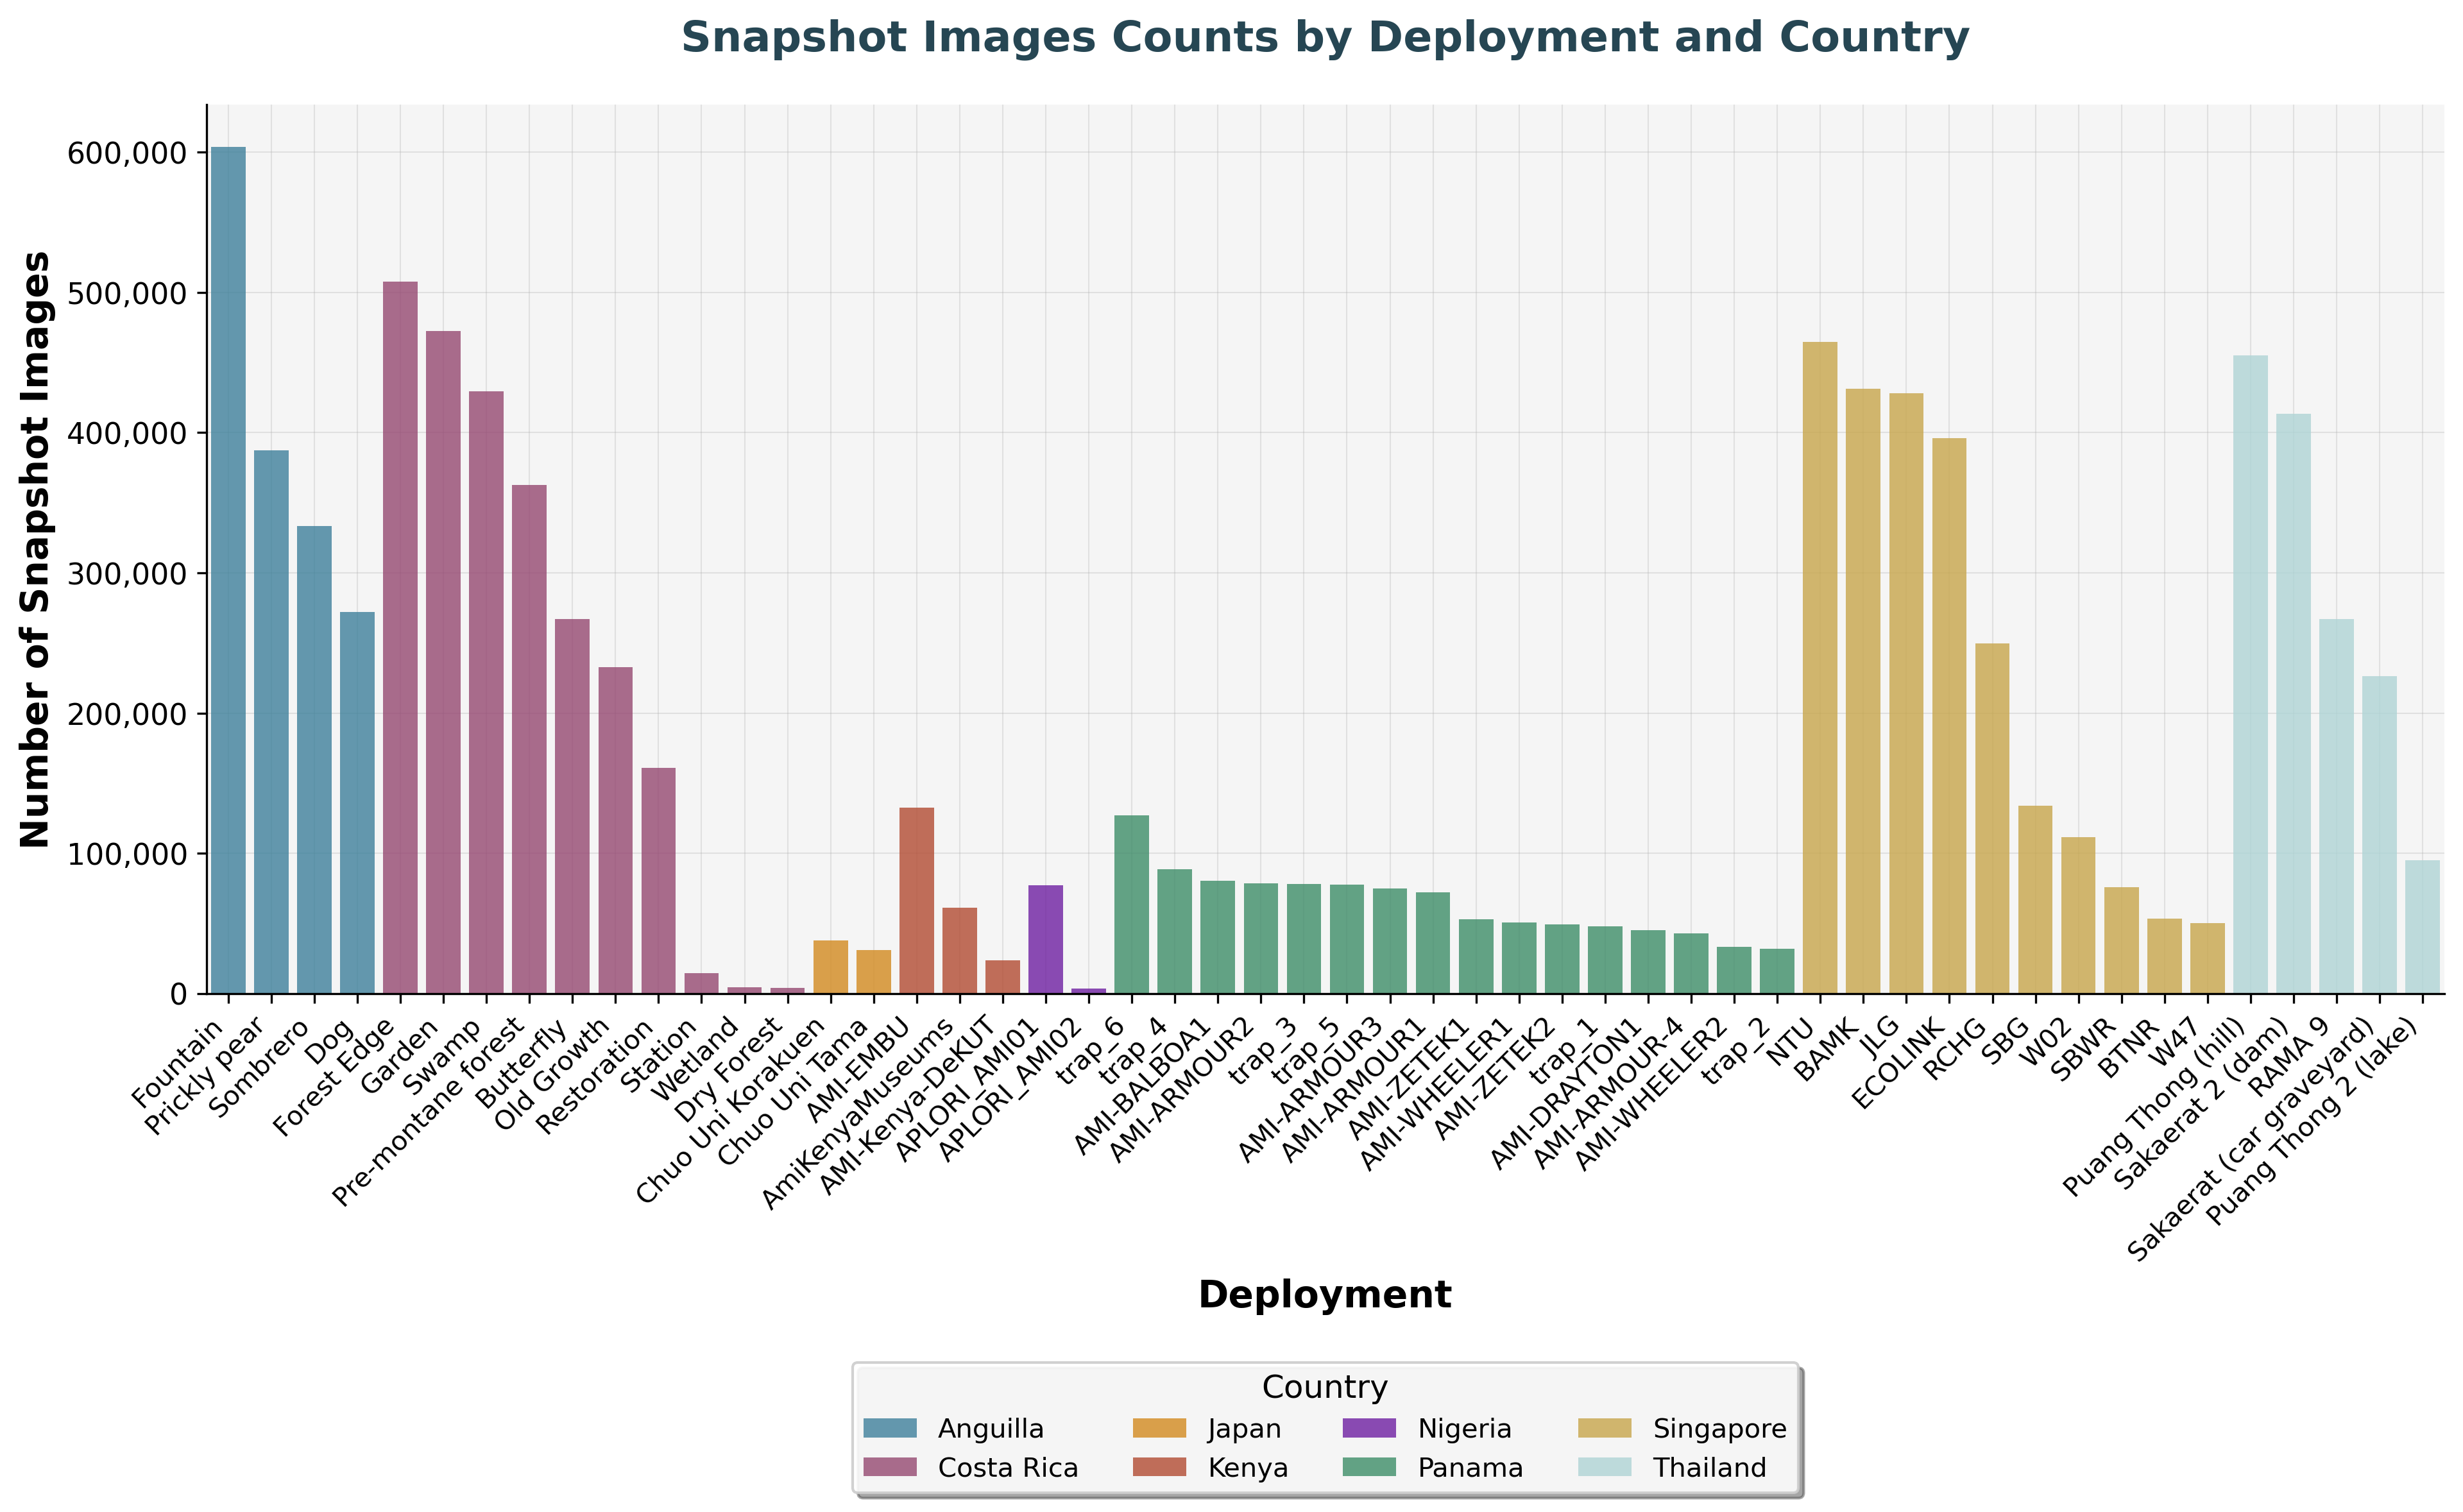
Across deployment sites, millions of snapshot images have been collected, from forests to grasslands and beyond, showcasing the scale and diversity of biodiversity data gathered worldwide. The variation in counts mainly reflects how long each site has been running.
Audio Data Collection
However, our systems also capture audio and ultrasound data. These recordings help us detect birds and bats in the future, complementing the visual data.
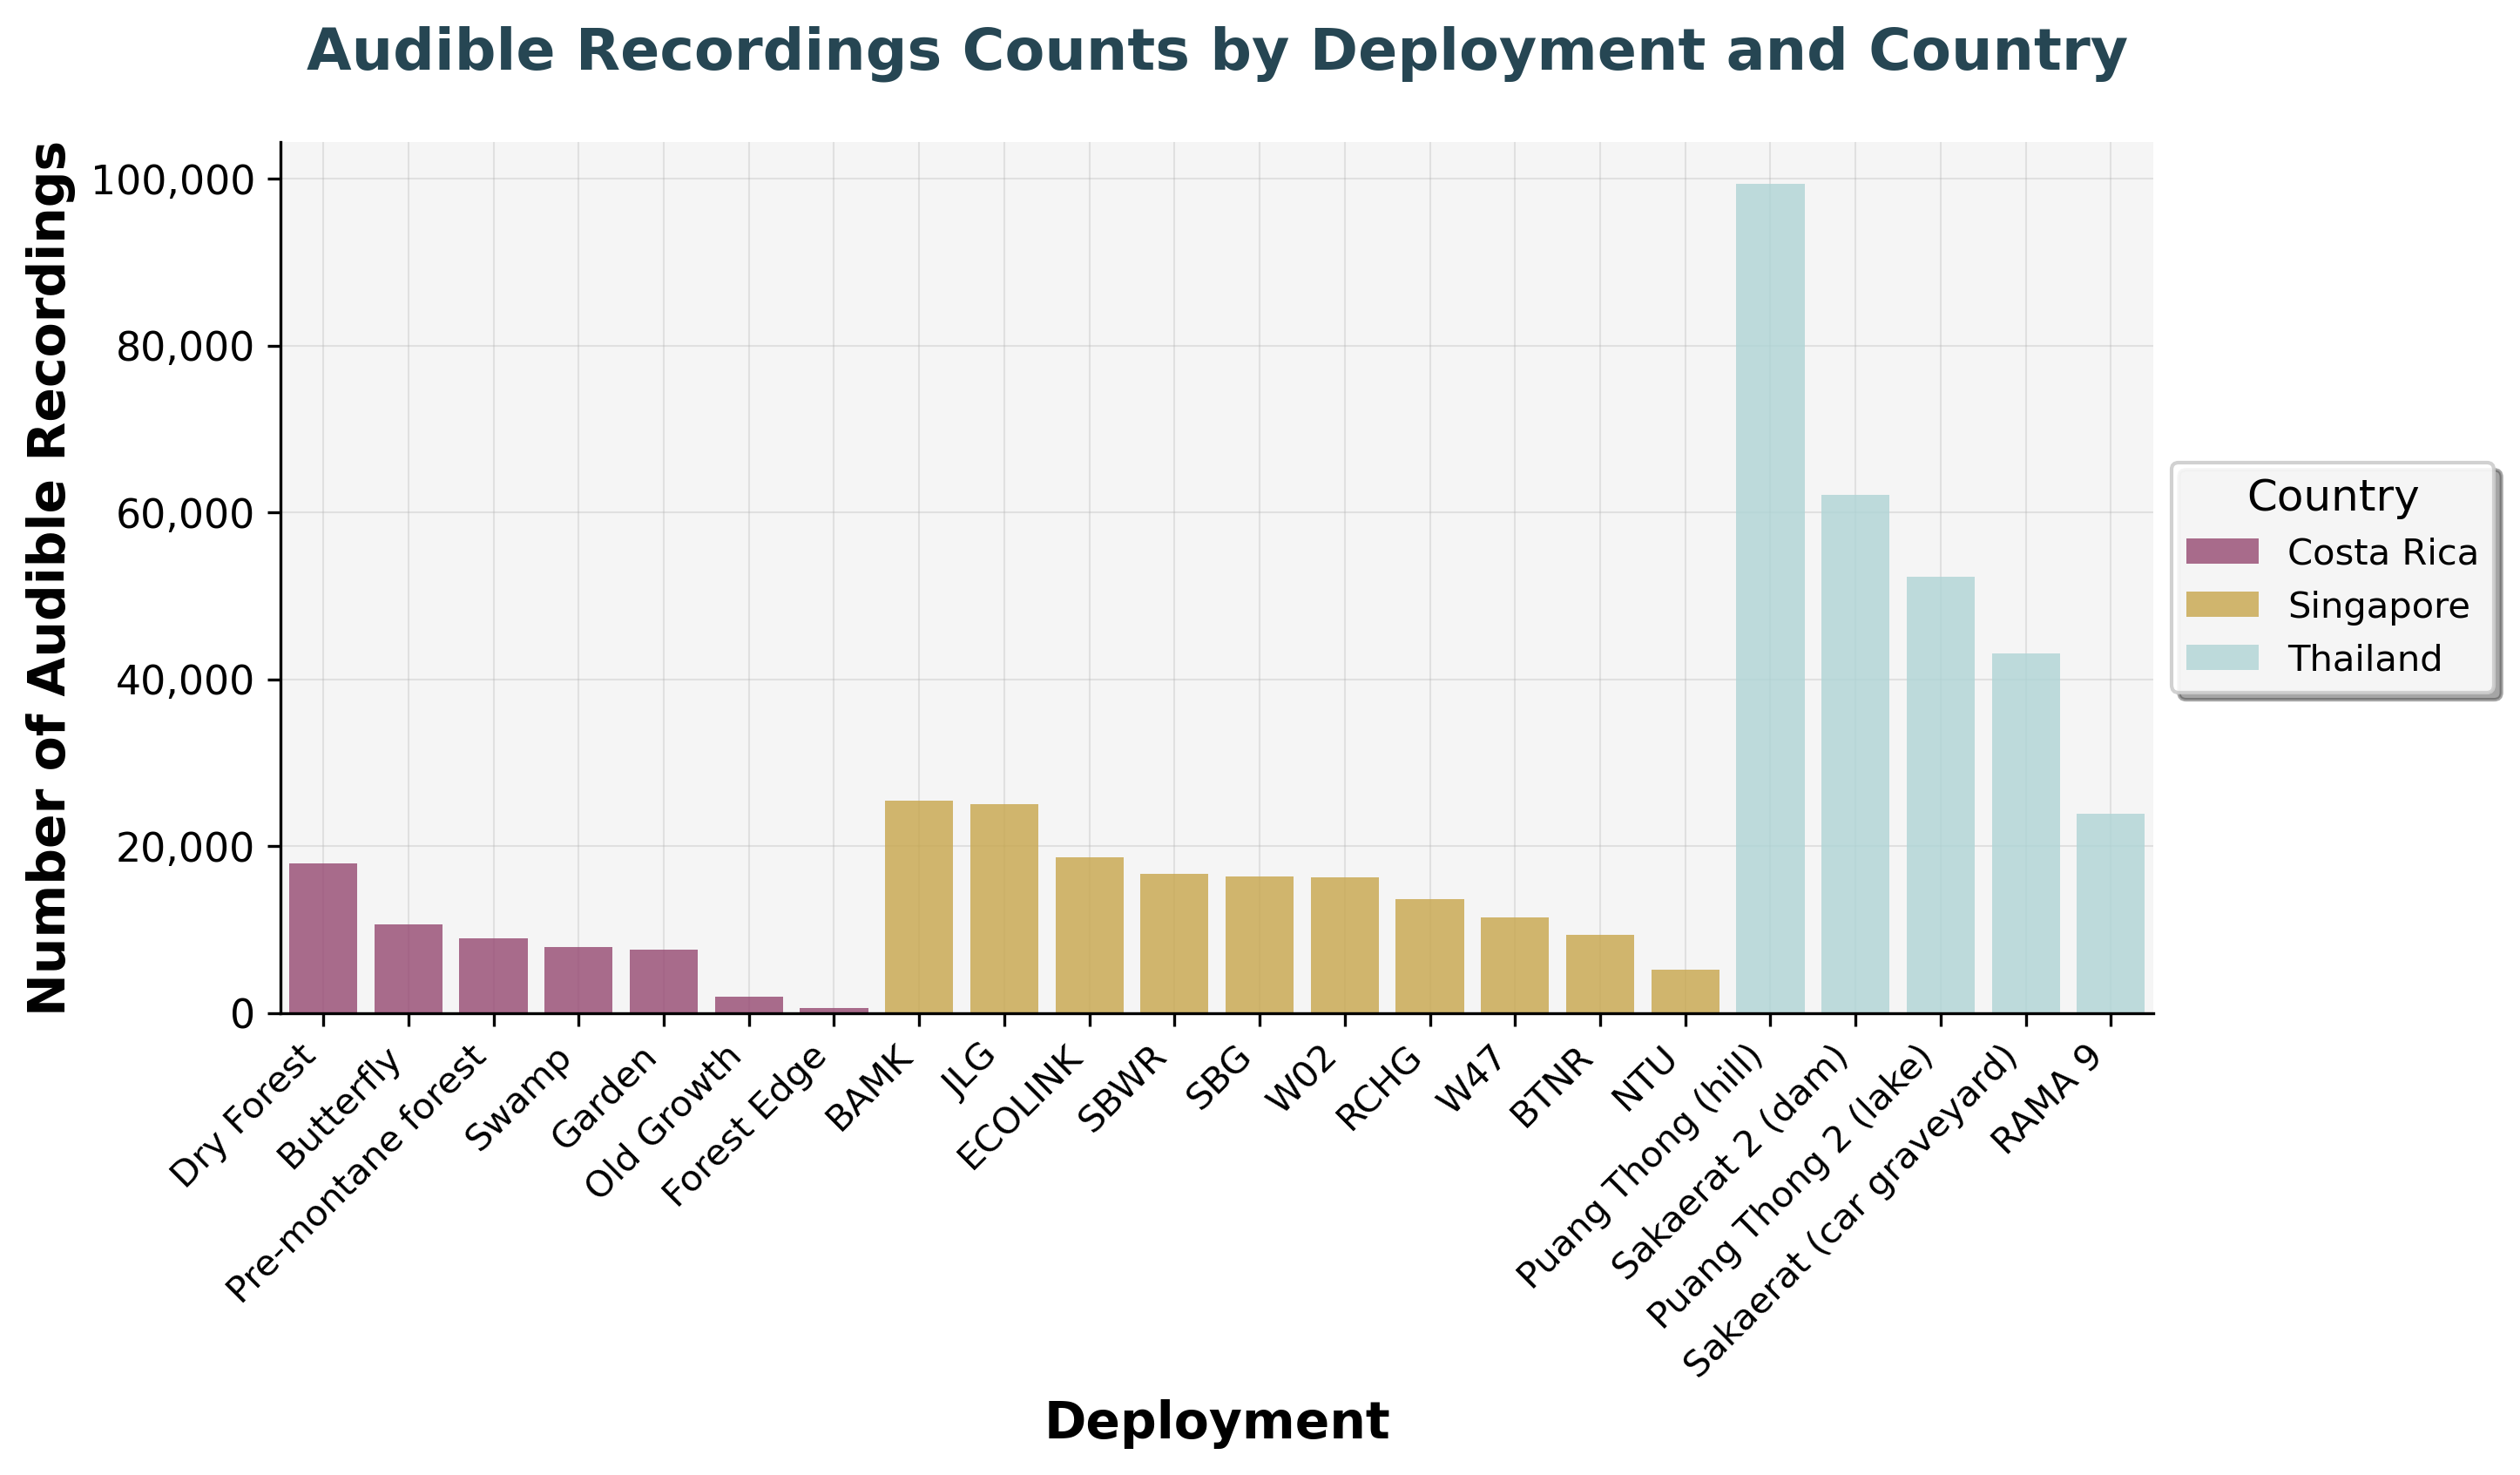
Distribution of audible audio recordings across different deployment locations, capturing bird songs and other wildlife sounds.
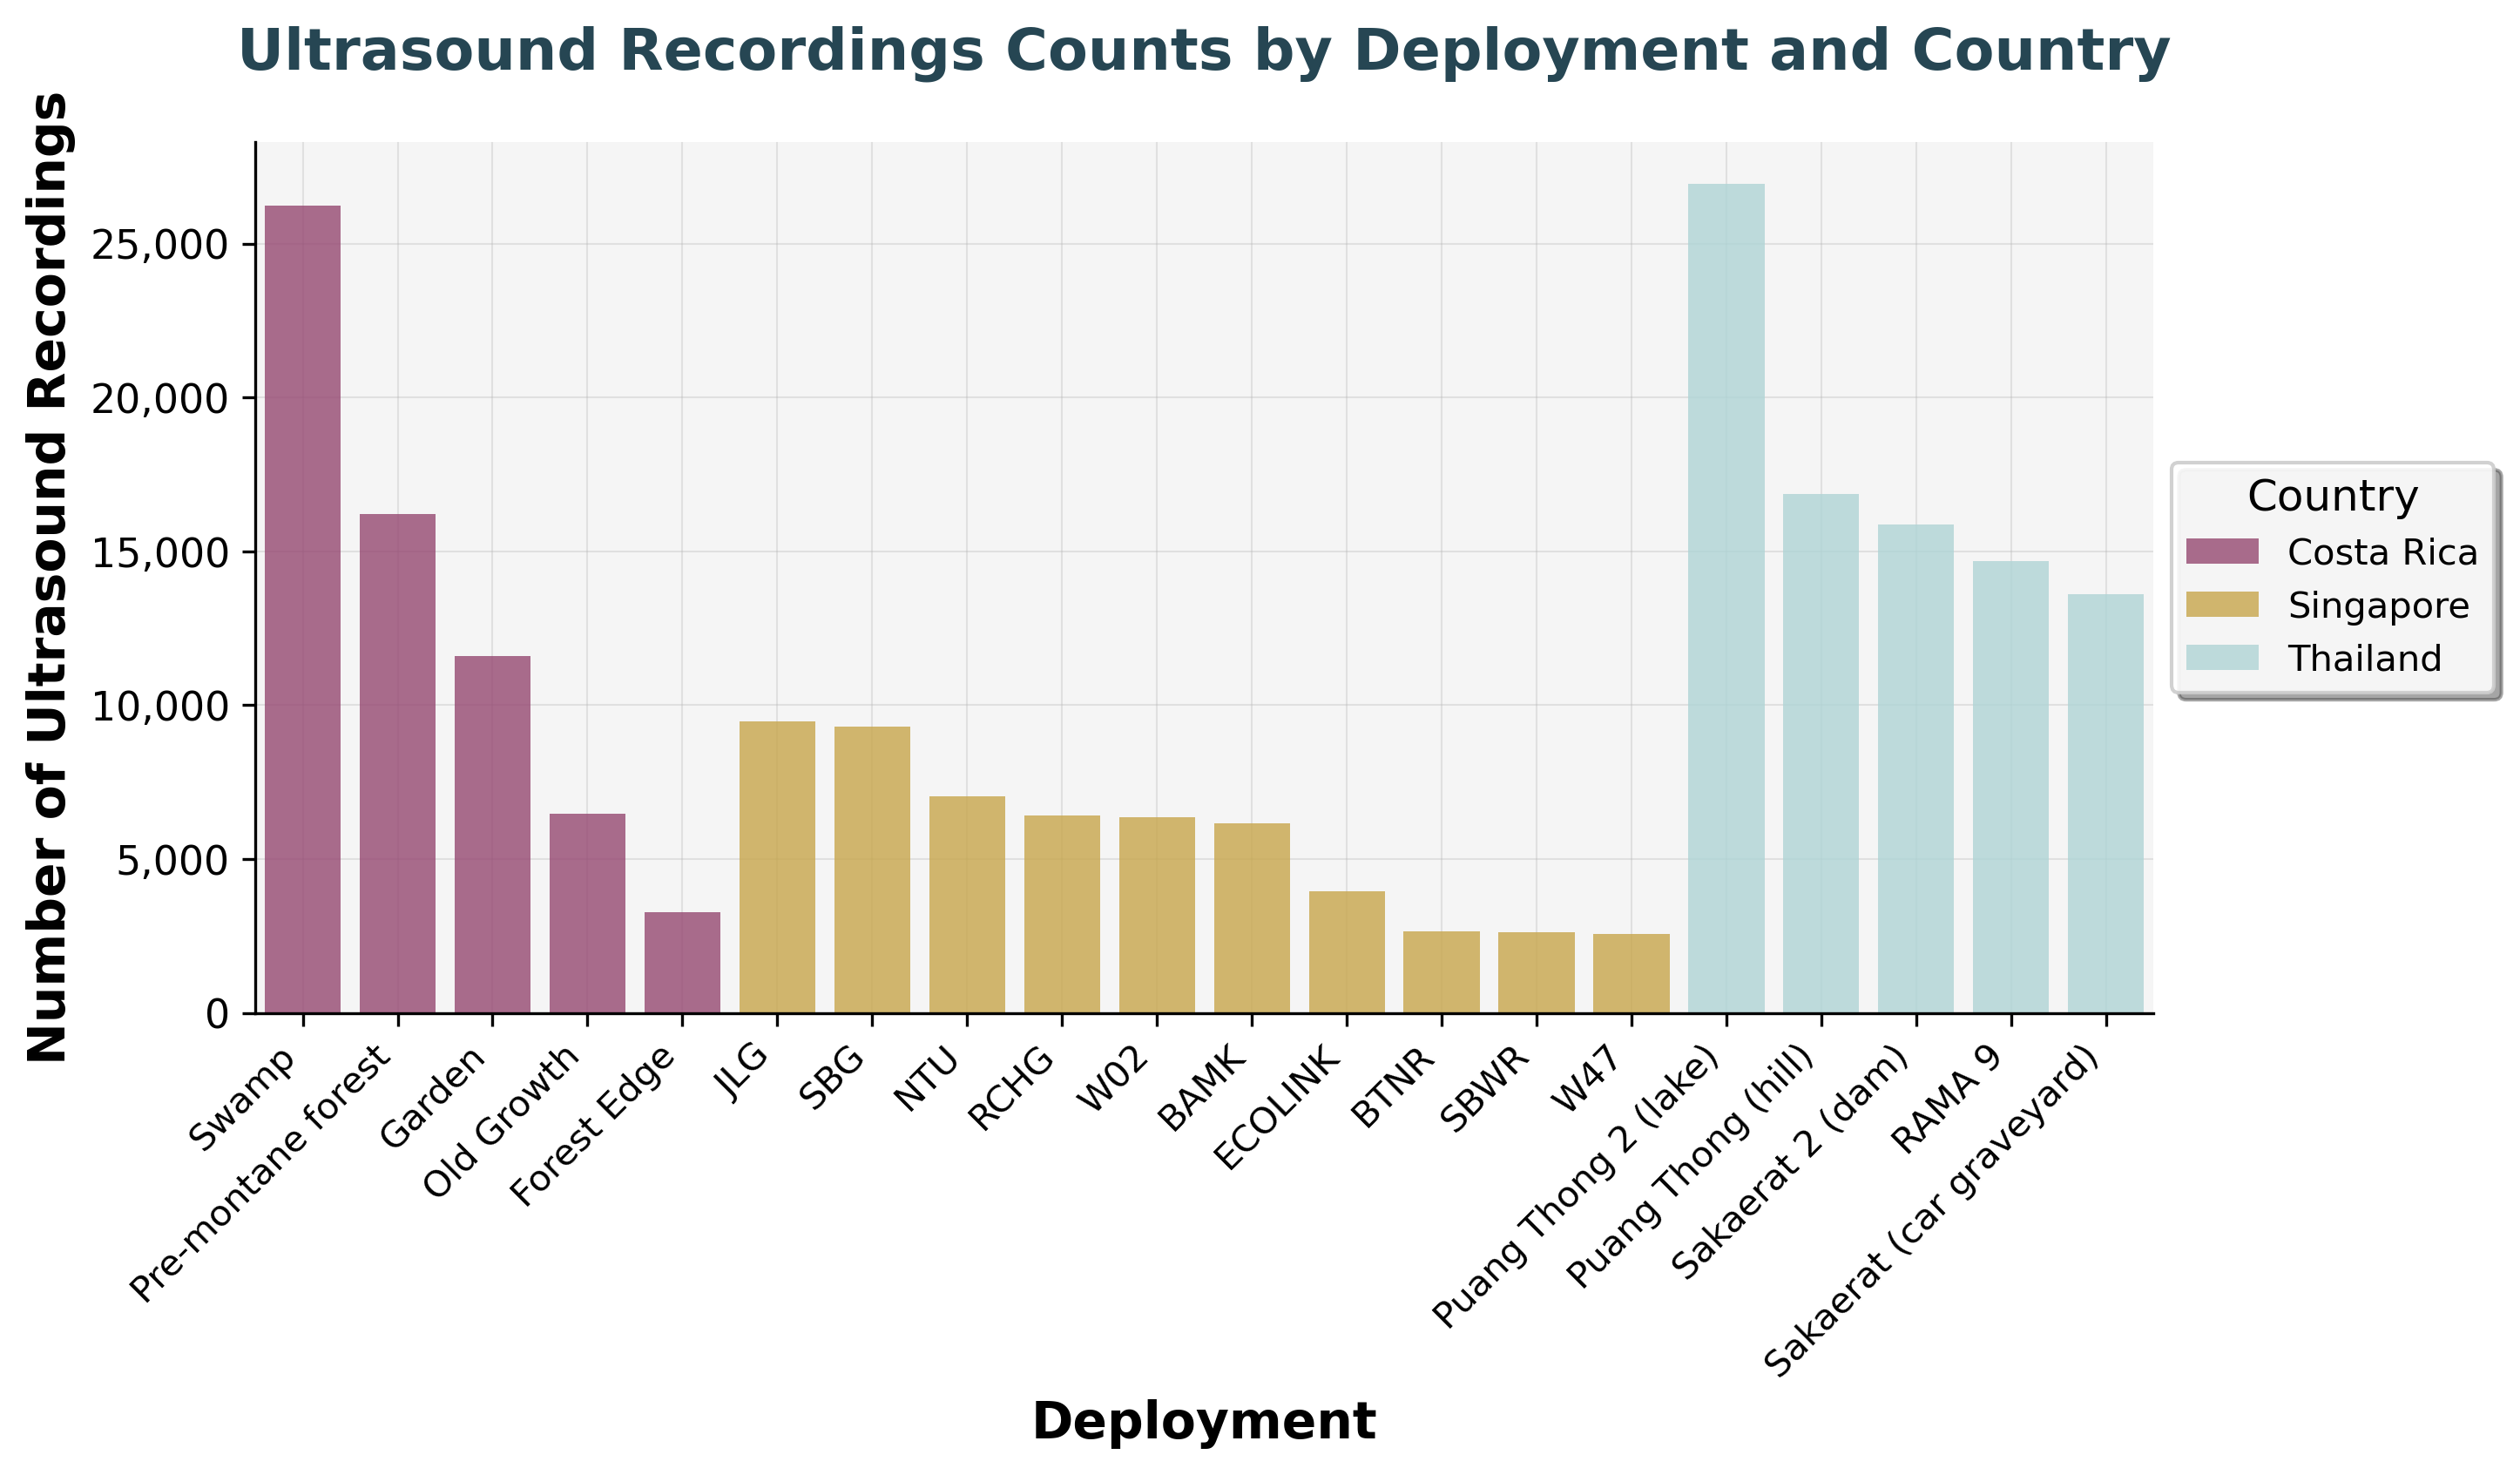
Distribution of ultrasound recordings across different deployment locations, capturing bat echolocation calls and high-frequency sounds.
Together, these views show where data is richest, where deployments were deployed longest, and how different sensor types contribute to the bigger picture.
Infrastructure to match ambition
Processing this scale of imagery demands serious infrastructure:
- High performance compute clusters with GPUs to train deep neural nets and perform inferences
- Distributed data storage (object stores, S3 style buckets) to hold petabytes of image data
- Efficient pipelines to stream batches, manage metadata, and track individuals
- Automated validation to flag anomalies such as sudden shifts in brightness, unusual class distributions, or corrupted batches
Every model version links back to the exact image subsets, augmentation settings, and hyperparameters used, ensuring reproducibility.
Inferences
The real impact is seen when images are processed through trained models. As of October 2025, almost 7 million images have been processed, and this number grows daily as deployments continue.
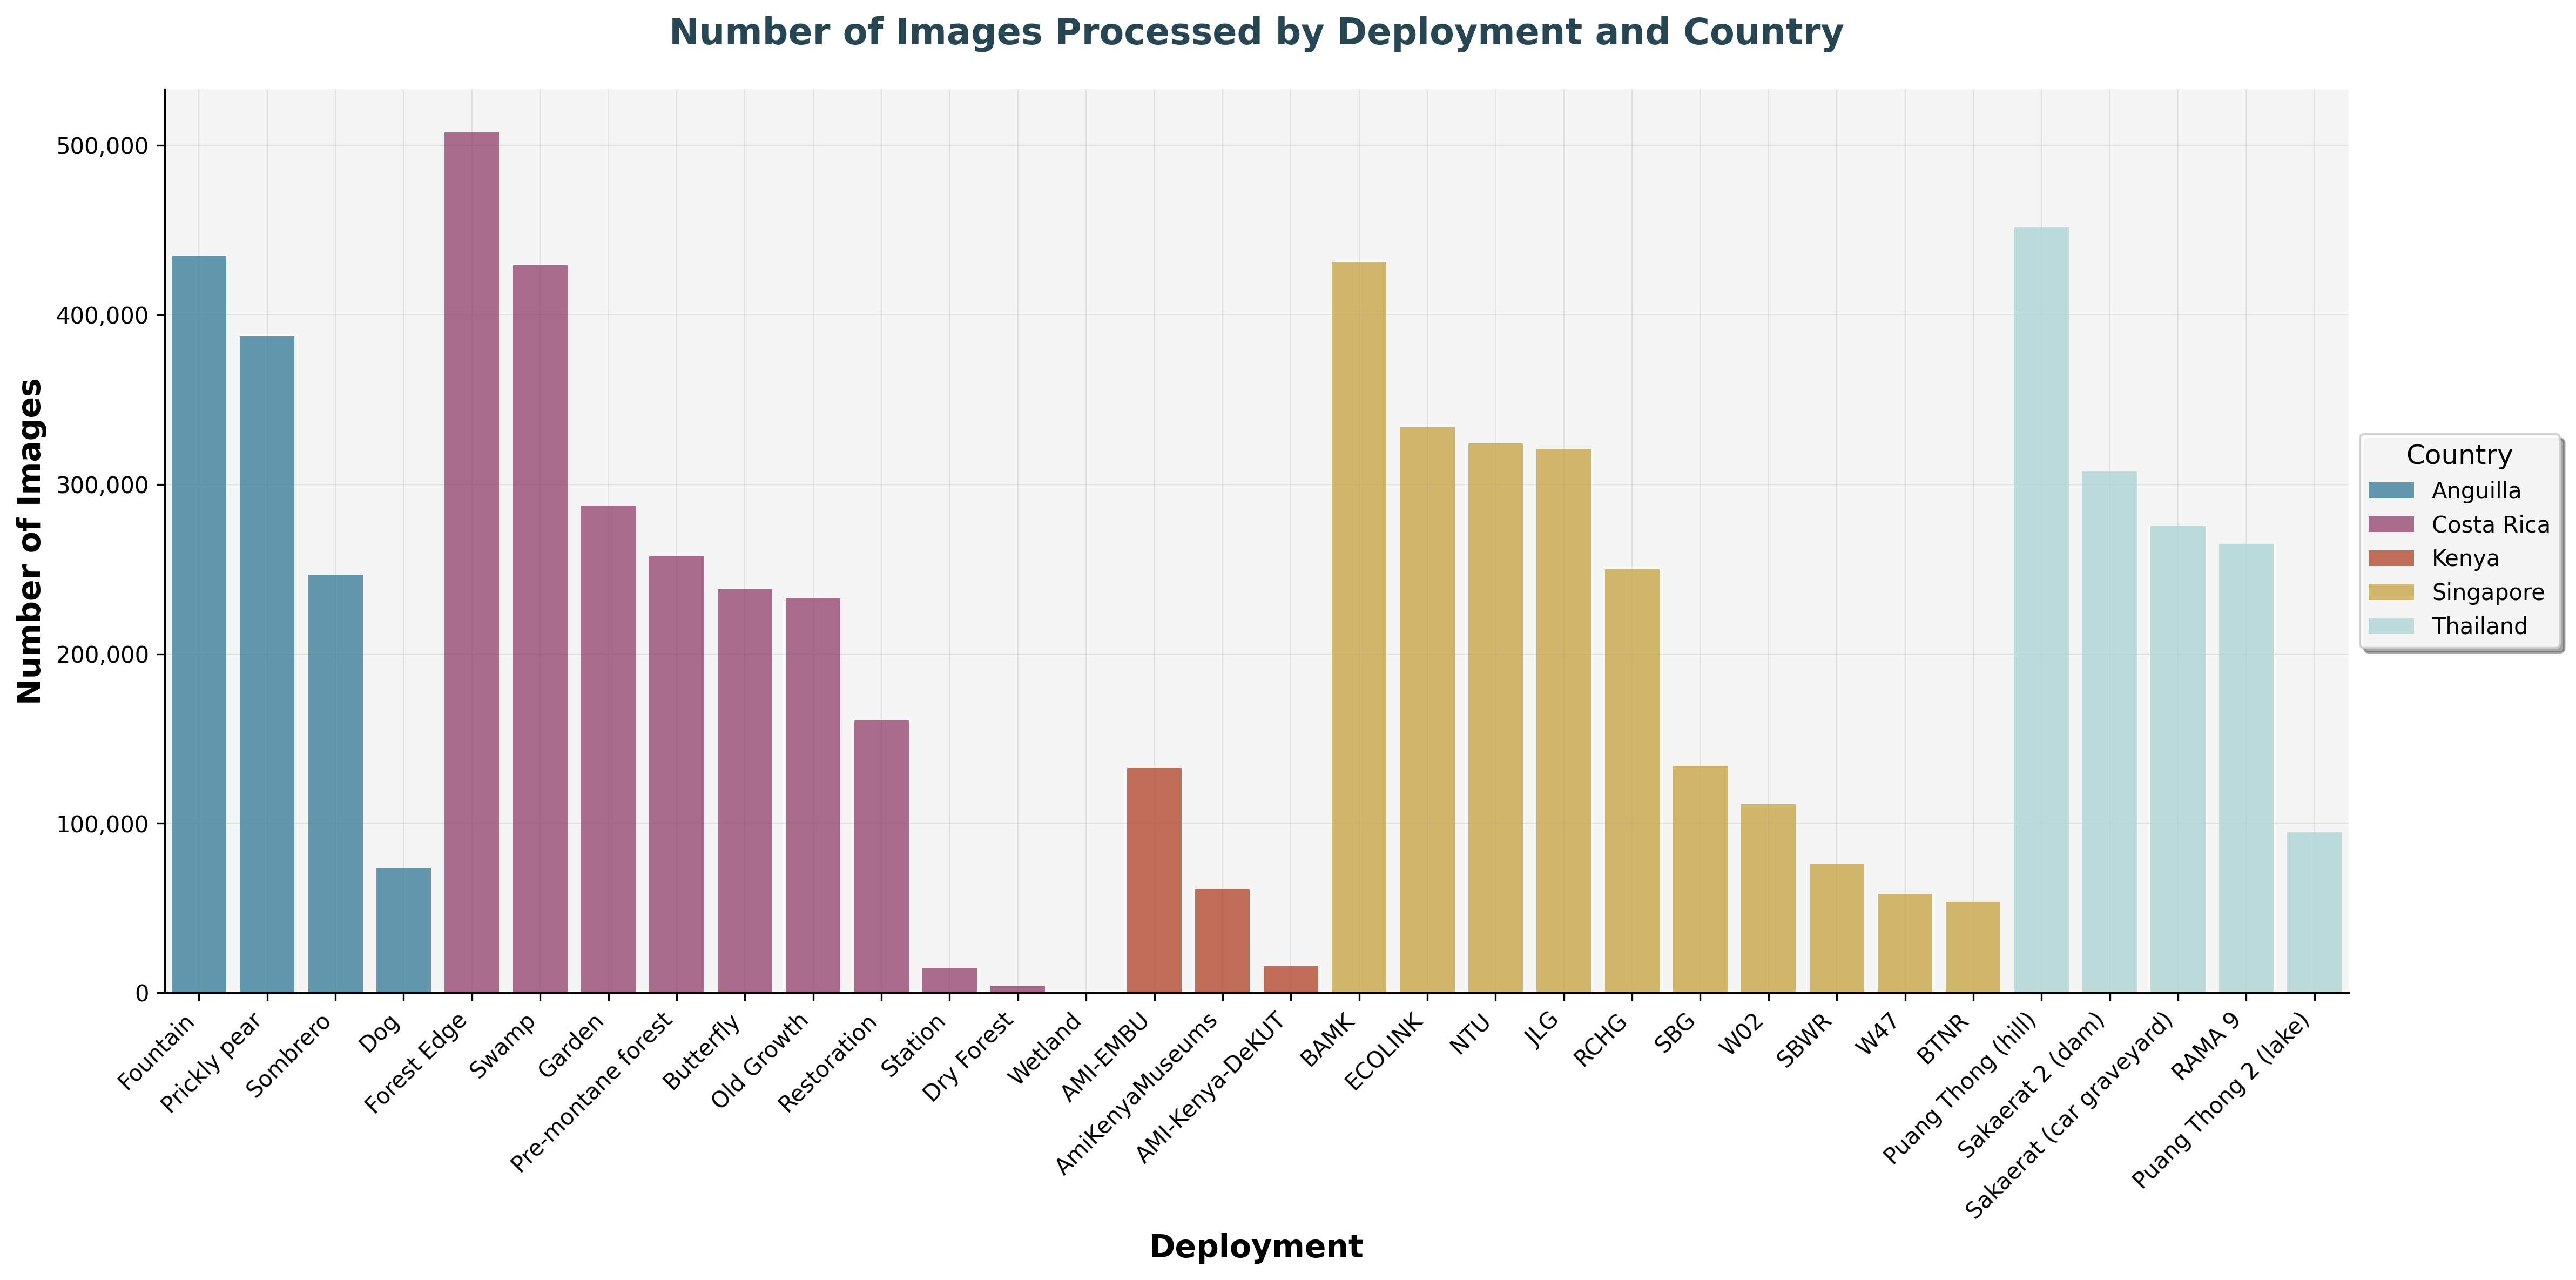
Number of images processed per deployment location, highlighting the variation in data volume across different sites.
We can take this a step further and look at the number of moths and crops (objects) detected across these images:
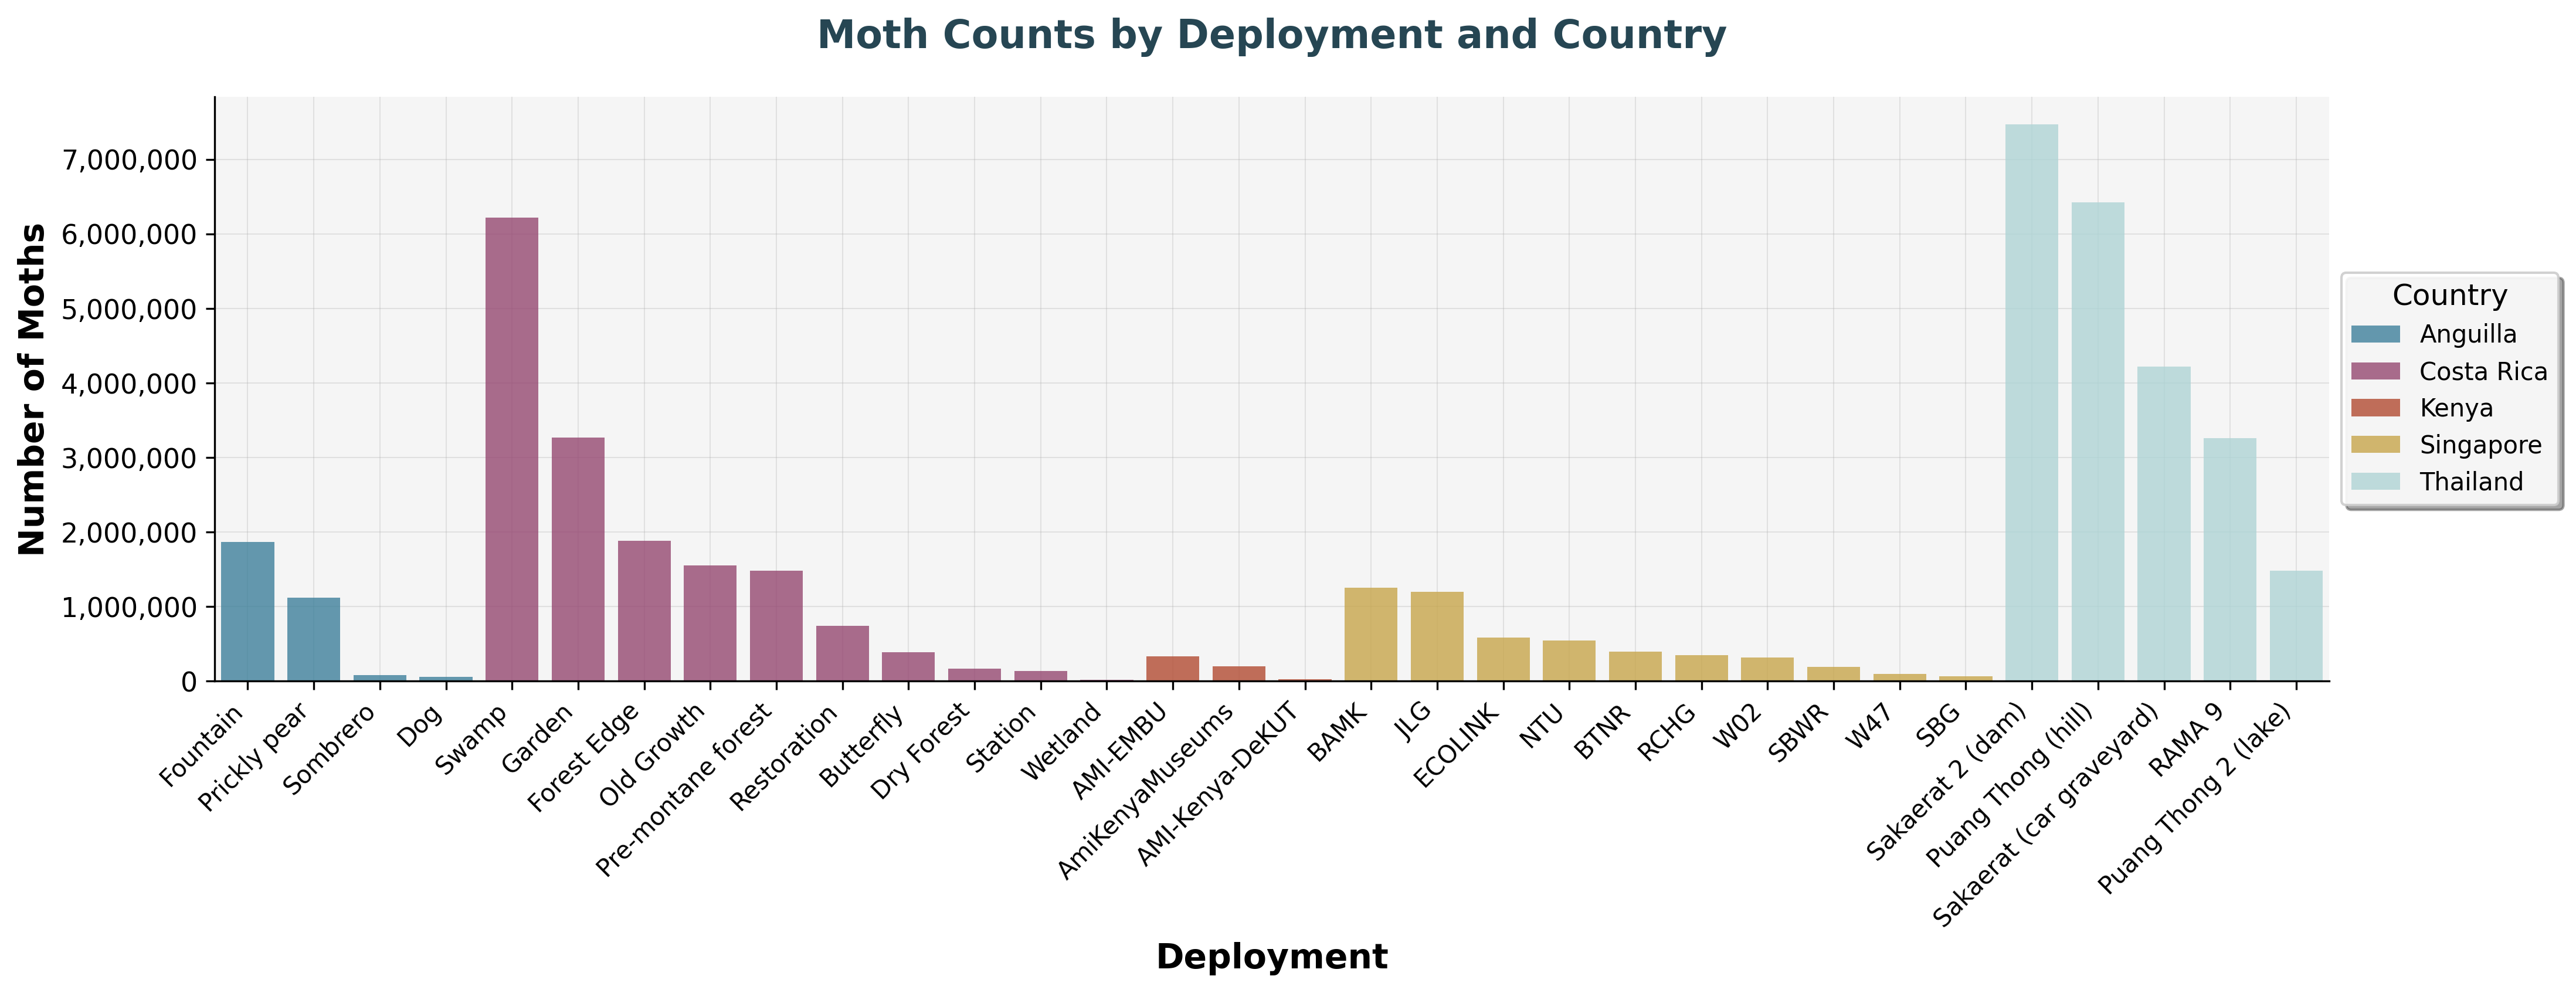
Distribution of moth audio recordings across different deployment locations, capturing various nocturnal sounds.
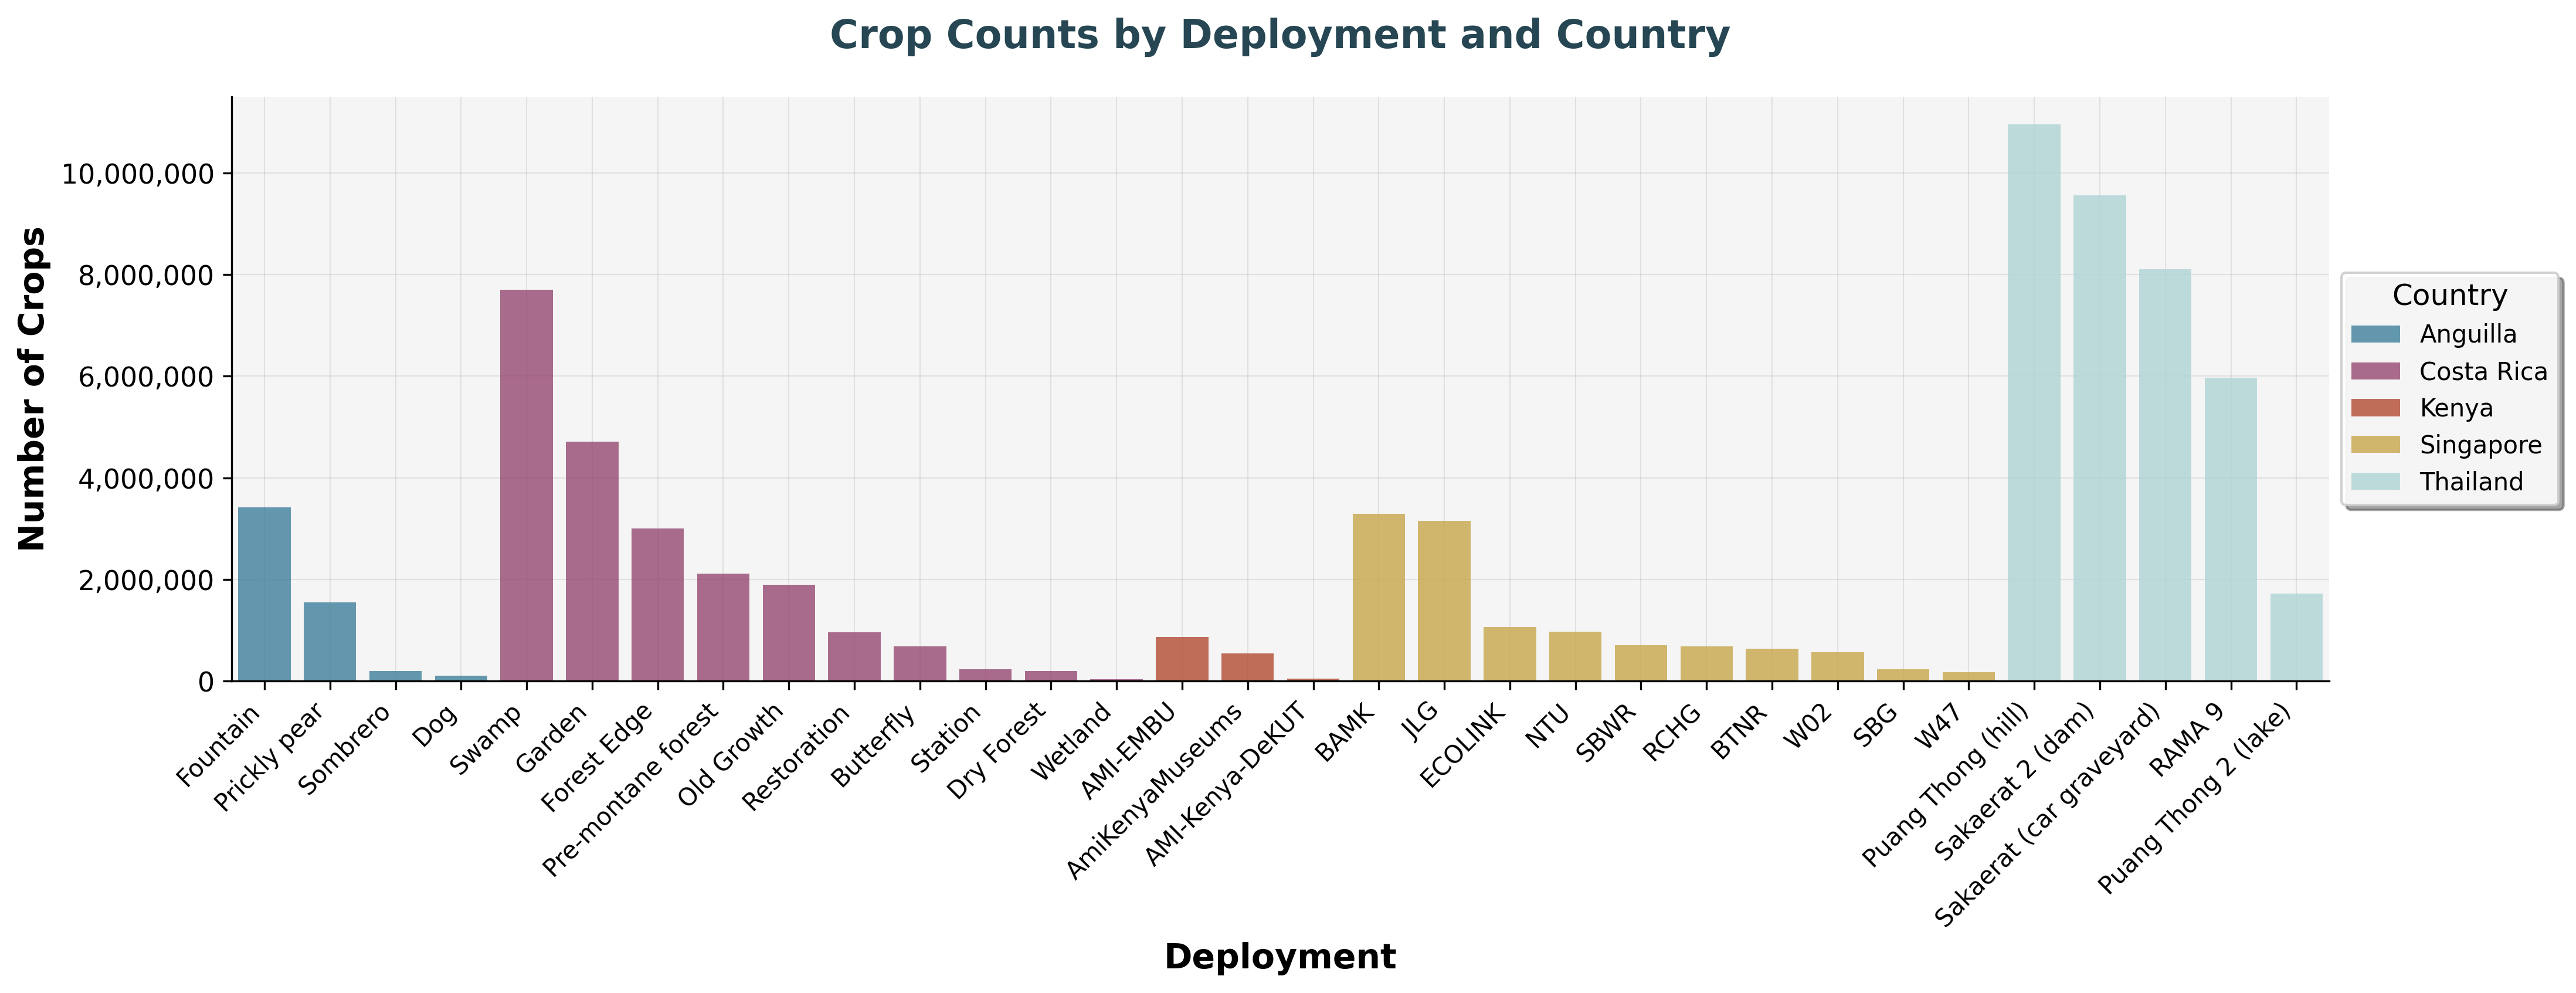
Distribution of crop audio recordings across different deployment locations, capturing various agricultural sounds.
When scale becomes strength
What begins as the challenge of "too much data" becomes a strength. With breadth and depth, our models generalize better across geographies, and species. Subtle ecological patterns emerge, offering the potential to highlight seasonal shifts in behaviour, or flag species of ecological relevance that could guide conservation efforts. This is the promise of big beautiful data: transforming overwhelming complexity into insights that help us understand, protect, and actively support biodiversity into the future.